GAP Analysis - How it works?
Gap Analysis is a very simple concept. For each attribute, the difference between the expectation and delivery is measured and sorted from highest to lowest. It effectively highlights the attributes you need to focus on.
In order to run GAP Analysis, you must use the Side-By-Side Matrix question type. This automatically configures the system to run GAP Analysis across the different dimensions of the matrix. To add a Side-By-Side Matrix question, please see the References section below.
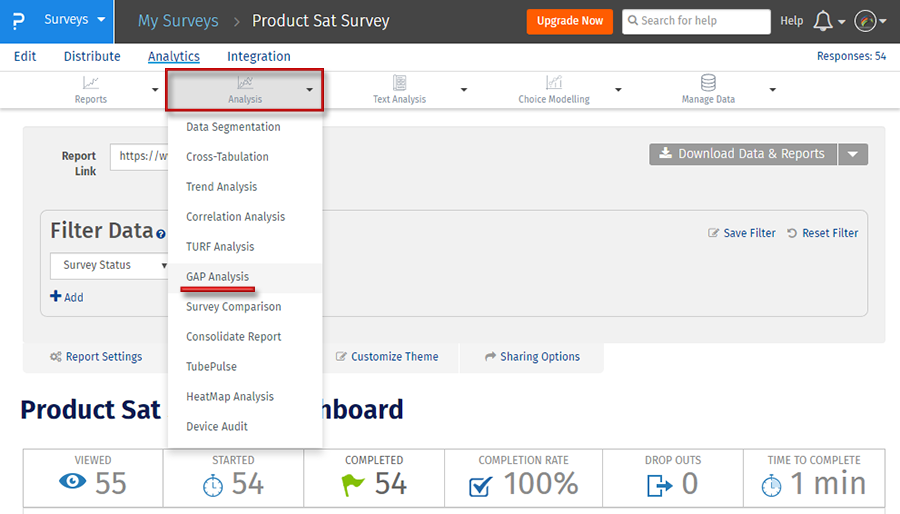
- My Surveys (Select Survey) » Analytics » Analysis
- Click on GAP Analysis under Analysis
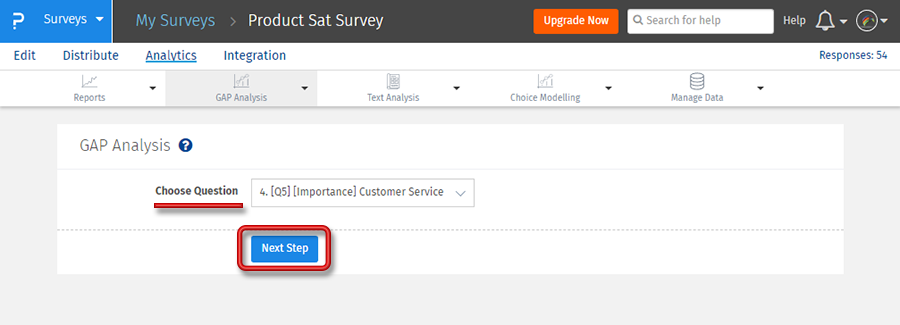
- Select the question from Choose Question drop-down and click Next Step
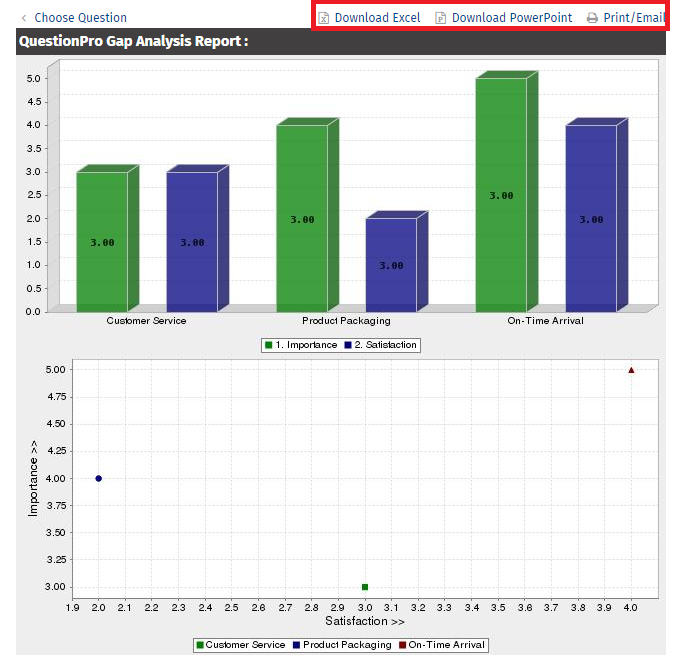
- The GAP analysis charts will appear.
- You may download this report in Excel, Powerpoint, print or email


Customer Service Top Left Quadrant High Importance / Low Satisfaction Product Packaging Bottom Left Quadrant Low Importance / Medium Satisfaction On-Time Arrival Right Middle Quadrant High Importance / High Satisfaction
Let's take the above example. Even though “Product Packaging” has a lower Satisfaction Score here, it’s obvious from the chart that it’s of lower importance than “Customer Service.” This XY-Scatter Plot captures both the satisfaction and importance dimension in the same chart visually.
This feature is available with the following licenses :

